| Workpackage 4: From Signal to Data |

|

|

|
|
Workpackage 4 is devoted to the development of basic software tools for the visualization and processing of mass spectrometry data (spectra and images). The functionalities developed in WP4 have been used in WP3 and WP6 to provide keys and tools for the analysis and interpretation of round robin test samples, but also images of sane/diseased tissues and cells. More generally, these software tools will afford assistance to mass spectrometry experimental staff, chemists and biologists in the processing and interpretation of their biological data. The objectives of WP4 are: Acquisition of data from several mass spectrometry equipments
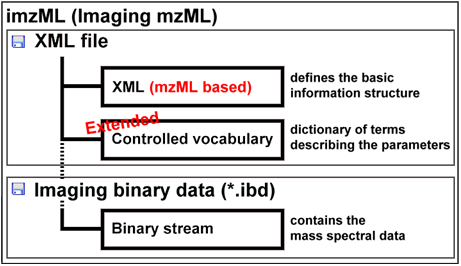
This presentation is organized by software tools, with a description of the functionalities offered by each tool. imzML data standardUp to year 2008, there were two separate universal data formats appropriate to store raw mass spectral data: mzData developed by the PSI (Proteome Standard Initiative; http://psidev.info ) and mzXML developed at the Seattle Proteome Center at the Institute of Systems Biology. Having two separate data formats to save the same data was confusing and meant in most cases more programming to be done. Therefore the PSI together with the ISB developed a new format mzML to replace the predecessors. The mzML data format was published on 1st of June 2008. The mzML data format consists basically of three different parts:
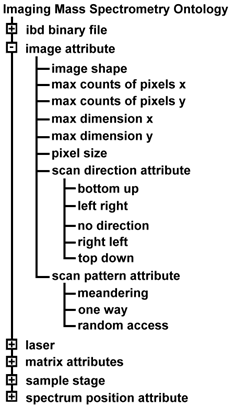
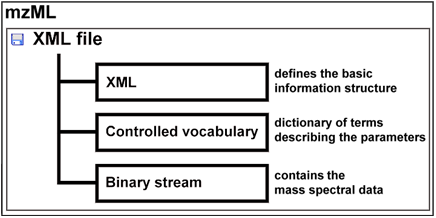 To describe an image composed of hundreds or thousands of spectra, additional information is needed e.g. the x and y position of the spectrum, the scan pattern, etc. and the controlled vocabulary has to be extended to meet the demands of imaging mass spectrometry. This and the often huge amount of binary data are the reasons why the COMPUTIS project group decided to modify the mzML data format to create the imzML standard format for imaging mass spectrometry data. An obo file (open biomedical ontology) was created that contains the new additional parameters needed to describe imaging mass spectrometry experiments. These parameters are linked to each other and to the previous existing controlled vocabulary of HUPO-PSI.
Due to the large amount of data, the spectral data are stored in an external binary file (Imaging Binary Data, IBD) with mass spectral data saved as binary data to reduce the data size.
The imzML data format is held very closely to the mzML original. The current version of imzML is 1.1.0 RC1. It was announced on 31 August 2010 at the IMSC conference in Bremen. imzML has been extensively discussed with users and vendors at various occasions.
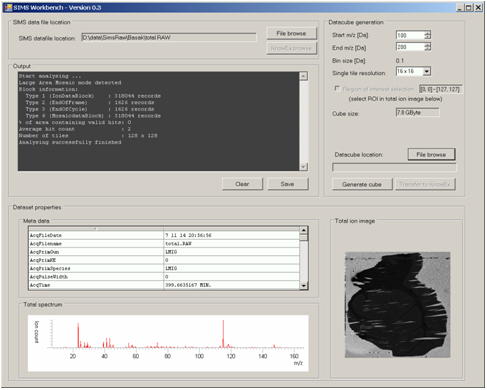
Data Cube ExplorerFOM developed a processing tool for converting SIMS imaging data into a format compatible with DataCube Explorer software.
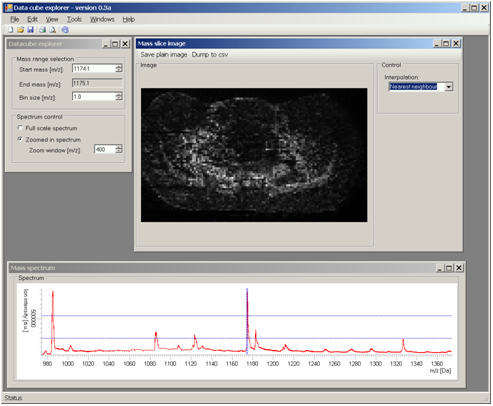
Data cube explorer is a user-friendly tool to easily explore imaging mass spectrometry dataset, independently of the original data modality. This tool enables both the spectral and spatial exploration of the generated generic data files, a spectral analysis of region-of-interest and it includes a self-organizing map feature for image classification. It reads the imzML format.
Data Cube Explorer can be downloaded freely at http://www.maldi-msi.org/
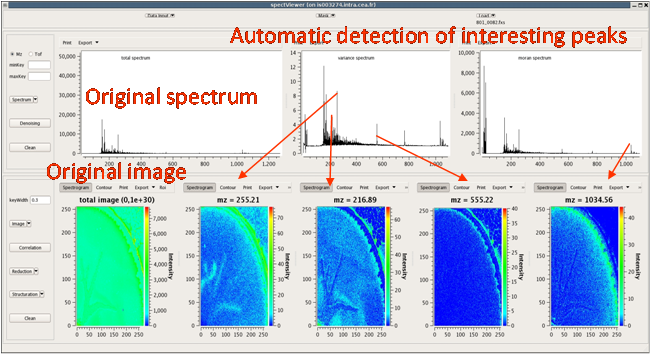
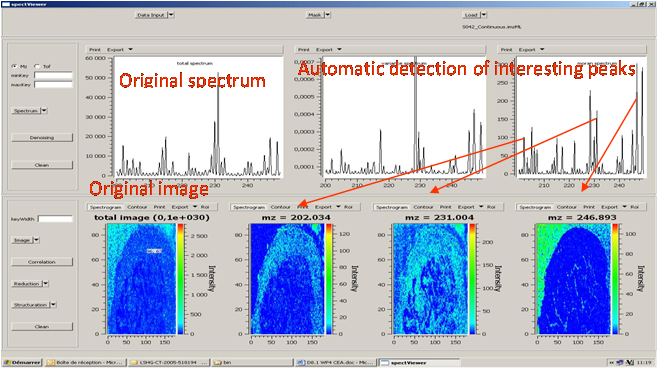
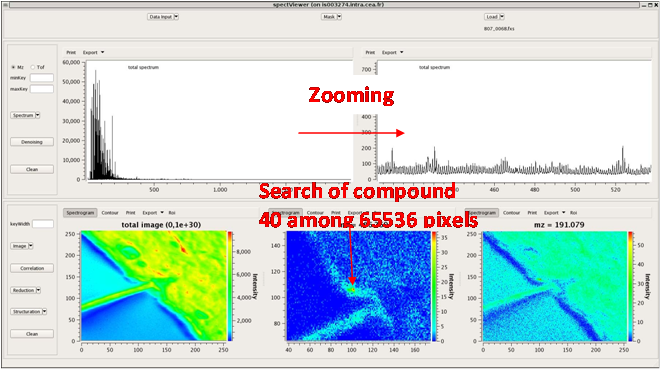
Easy MSI (also called SpectViewer)CEA developed a software tool providing basic functionalities for data display and spectral/spatial exploration, and a user interface for some more specialized treatments such as denoising spectra or structure analysis. The main functionalities of the visualization module are zooming, peak or pixel picking, interactive tool to define polygonal regions of interest and display of the resulting spectrum, indicators to detect interesting peaks or peaks correlated to a given one, display of weighted total image, correlation matrix between peaks, and dump in SVG or postscript formats.
Elementary transformations of data concern image cropping, image binning, denoising and baseline subtraction.
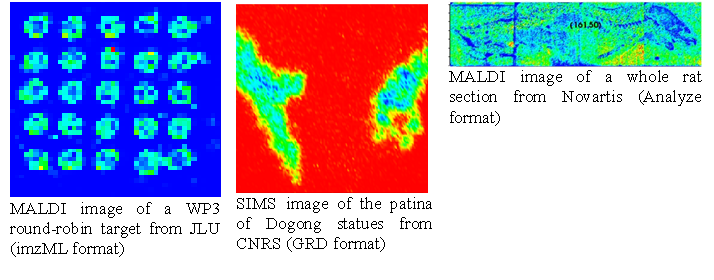
Easy MSI reads and processes SIMS and MALDI data in Analyze format, GRD format (Ion-Tof) or imzML format without binning.
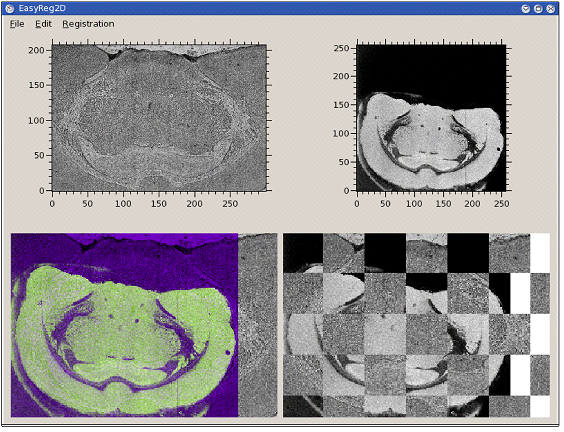
EasyReg2DCEA developed a C++ software for multimodal 2D image registration. It can be used, for instance, for registering microscopy images with images extracted (clusters, total current...) from the spectral data. In order to offer the multimodal registration capability, the chosen criterion for registration is the mutual information between the two images.
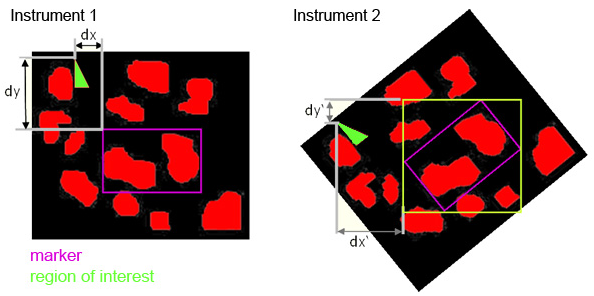
SamPS (Sample Positioning System)JLU developed SamPS (Sample Positioning Systemto enable the combination of complementary imaging methods with the help of position markers, attached onto the target surface. Since images of the different imaging techniques often differ heavily, SamPS is not restricted to one special marker, but it is flexible since it allows the definition of different markers. Therefore the user defines the marker in the image that was acquired with the first method. Furthermore he defines an additional region that shall be analysed with another method. After that the sample is placed into an instrument capable to perform the second imaging measurement. SamPS detects the position marker semi-automatically and calculates the location and size of the region of interest. Then, with the help of these data, the region can be imaged. Finally, SamPS combines the two different images of the region of interest.
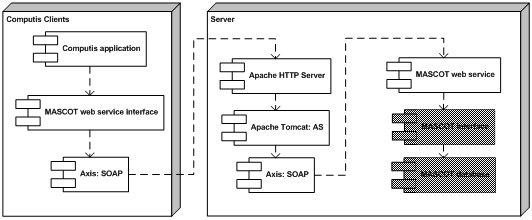
Mascot webserviceFOM developed a MASCOT module consisting of two parts. The first is a wrapper web service written in Java around the MASCOT application on the server. The web service uses Apache and Tomcat to deploy the web service and to handle the requests. The web service itself acts only as a gateway between the client and the MASCOT search engine.The second part is a web service client that uses the MASCOT web service and can be embedded in other software. This software is available in both Java and C#. In the MASCOT web service architecture, the blocks represent the individual software components of the system. The gray shaded blocks represent the standard MASCOT database software.
Inventory of biological databasesIn order to identify the biological databases most suitable for the identification of proteins and peptides in the project, CEA carried out an inventory of the general biological databases and the main useful specialised databases. The study consisted in identifying the databases with a description of their content and the query tools to interrogate them.
Identification of biomarkers of the Duchenne muscular dystrophy using the lipid database of CNRSGénéthon identified lipid biomarkers of the Duchenne muscular dystrophy thanks to the lipid database of CNRS and the Lipidmaps prediction tool. The database created by CNRS contains m/z spectra of about 30 most frequently occurring lipids within phospholipids, di-and triglycerides, ceramide derivatives and isoprenoids lipid families. This database is built as a reference data book of ToF-SIMS mass spectrum profiles for these lipid families.
|
|||||||||||||||||||||||||||||||||||||||||||||||||||||||||||||||||||||||||||||||||
| < Prev | Next > |
|---|

