| Workpackage 5: From Data to Knowledge |

|

|

|
|
Workpackage 5 has focused on the application of the developed imaging MS methodologies, strategies and protocols to various analytically challenging problems in the life sciences. In doing so it has highlighted the advances in the European imaging Mass Spectrometry realized by the efforts of the Computis consortium. Several of the developed strategies have found their way to research professionals all over the world demonstrating the broader international impact. The objectives of this workpackage throughout the project were:
The concise list of results below is a selection of the highlights of the project.
Knowledge base ontology The diverse available imaging MS infrastructure within the COMPUTIS consortium has lead to experimental descriptors. This description is the basis for the ontology’s used throughout the project. The different metadata elements are used to design and realize the imzML common data standard. In addition an overview of imaging MS processing software is provided. All of this information is captured in the knowledge exchange system KnowEx. In this metadata management system a specific virtual organization for COMPUTIS is created. This concept, implementation and application of KnowEx for the COMPUTIS project is one of the results of this workpackage. Computational research in imaging mass spectrometry over the last years has provided us with new concepts, a basic computational infrastructure and a variety of new tools. The benefits of this research for the biological sciences are evident, particularly for research areas in biomedicine. Both a multimodal and a multidisciplinary systems approaches are becoming much more prevalent throughout the life sciences. It is now common for life-science researchers from different backgrounds and disciplines to work together – or in other words it is now widely recognized that the complexity of many current scientific problems in the life sciences has outgrown the grasp of any single discipline. For example, a present-day research program might attempt to unify in-vivo imaging, proteomics and metabolomics approaches. This also applies to imaging mass spectrometry as a substantial amount of knowledge can be generated from these complex experiments. All aspects ranging from sample collection, sample preparation, instrument configuration, data acquisition, data analysis and interpretation need to be addressed by different researchers. From that perspective it is important to design a common platform in which these resources can be accessed in a comfortable environment. For that purpose within the framework of the COMPUTIS project we have examined the different expertise areas available within the consortium. A knowledge base that makes available this expert knowledge to researchers in the field is developed and implemented. The specific COMPUTIS related virtual organizations are described and highlighted in KnowEx. Central to the Knowex collaboration platform is the virtual organization (VO). A VO represents a group of researchers or (parts of) organizations from various disciplines working together in an organized manner to answer a common scientific question. The various partners in the VO all bring certain resources into the collaboration, see Figure below.  This figure shows how different parts of existing organizations (A, B and C) can be resource inputs for a newly formed collaboration, a virtual organization in Knowex terminology.
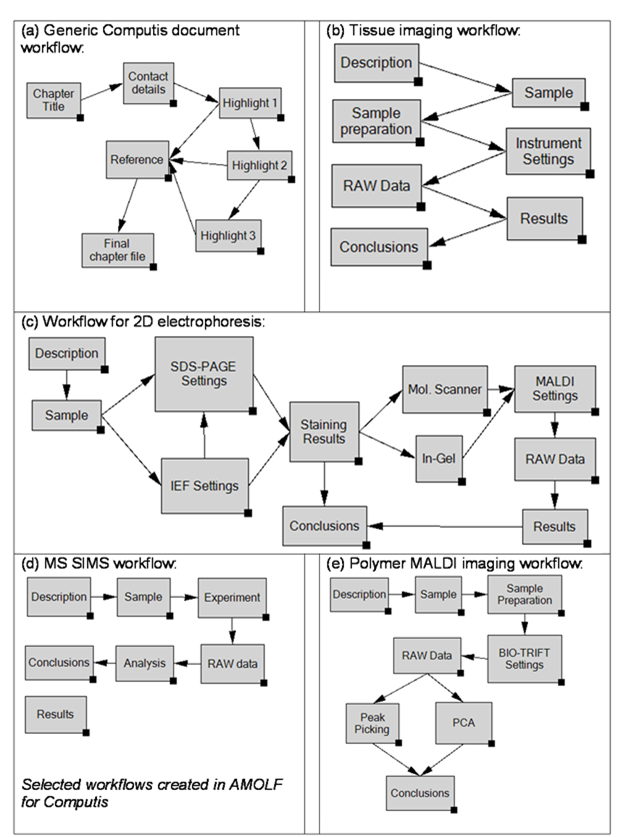
In this example of a VO, one partner shares his computational facility, another partner his samples and a third his instruments and processing software. All necessary ingredients to tackle the scientific problem come together in this VO and are shared among the collaborators. Details about the sample harvesting and preparation, as well as experiment settings and measurement data are immediately and easily available to everyone within the collaboration. Every VO member is instantly aware of any progress made within the VO. Considering today’s vast amounts of generated measurement data, it is very practical to be able to access and review data without having to transfer it first. Using Knowex it is possible to use previously created processing software and run it on the computational cluster of another collaborator, using data stored at yet another location. For example, in the mass spectrometry community a typical unprocessed dataset after half an hour of measurements can easily comprise a few ten’s of gigabytes. Using Knowex there is no more need for unnecessary duplication and/or transfer of this information. There is an array of Knowex workflow templates developed at AMOLF available for Computis project. They range from simple documents to detailed reports, cover various aspects of mass spectrometry methods and practices – see examples in the figures below.
Knowex is also illustrative as a facility of dissemination of every aspect of research achievaments and collaboration, and this little functionality can be regarded as special software for frequent reuse in Knowex. In this scenario, all participants, collaborators, and partner commercial companies are joined in a special VO containing templates with a specific format for poster-style presentable panels. Knowex was used to set up such a virtual organization. Presently, a standard workflow was created for Computis participants to input figures and text they would like on their poster, see Figure 8. publishing research status in this way has the advantage that the information is centralized and both the group leaders and group members can change and improve the content of the poster before approving the final content. The third party poligraphy producer then combines these data with the standard lay-out of physical paper posters. They subsequently print the posters and make PDF versions of the posters available in Knowex. Using Knowex thus not only uniforms the poster content, but also retains all the information at a central location and makes the content immediately available to the producer as well as the scientists.
Multivariate image analysis softwareThe mathematical basis, implementation and application of validated multivariate statistical tools for imaging mass spectrometry is a highlight of this workpackage. We review a set of basic classification tools that allow the identification of spectrally correlated features within an imaging MS dataset. These tools are employed to distinguish different tissue types for molecular histology. Their basis lies in clustering mathematics and they exist in a large variety of implementation. This report describes mainly the entry-level software packages, including different clustering tools, principal component analysis, feature recognition and orientation and a few excursions toward higher level processing using canonical correlation analysis (CCA). The implementations are illustrated with examples and workflow based approaches below.
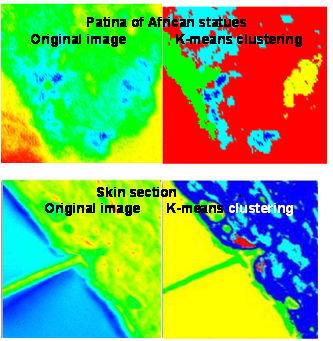
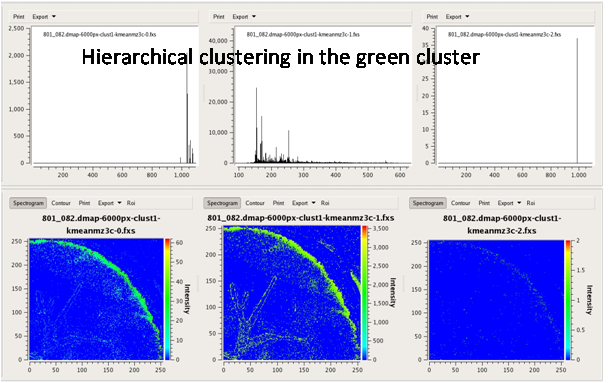
Easy MSI (also called SpectViewer)CEA developed clustering tools for spatial (i.e. pixel-based) classification or spectral (i.e. m/z-based) classification. Due to the large data volume in mass spectrometry imaging, it is necessary to select robust and fast algorithms capable to process data with limited memory capacities and short cpu time. CEA implemented 3 algorithms of classification: K-means, fuzzy clustering and hierarchical clustering.
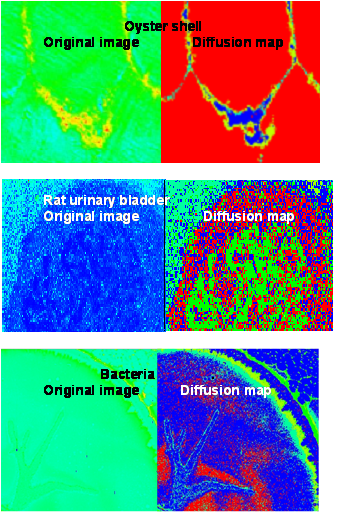
The diffusion map algorithm enables to reduce dimensionality of data by embedding data in a space in which data are more easily synthesized, and to do a clustering analysis in the reduced data.
Multivariate statistical analysis tools to analyze data from different samplesCEA wrote some routines in R language to provide simple interactive data manipulations and visualization of module results and to do cross sample analysis. These routines perform for instance: arithmetic, manipulation and structuration, test of statistical difference by Student and Mann-Whitney-Wilcoxon tests on spectra and images. These routines were used by Généthon to identify lipid biomarkers of Duchenne muscular dystrophy. DMD is a severe recessive X-linked form of muscular dystrophy characterized by rapid progression of muscle degeneration, eventually leading to loss of ambulation and death. This affliction affects one in 3500 males, making it the most prevalent of muscular dystrophies. The disorder is caused by a mutation in the gene DMD, located in humans on the X chromosome (Xp21). The DMD gene codes for the protein dystrophin, an important structural component within muscle tissue.
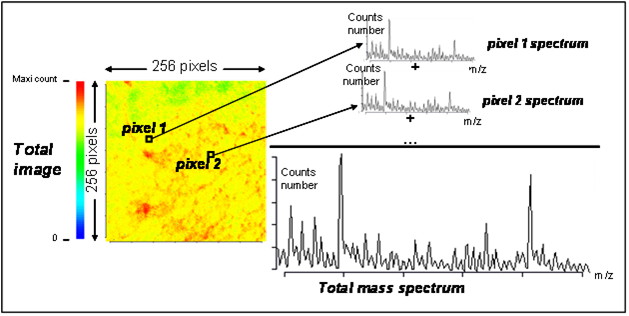
The mdx mouse has a genetic defect in the homologous region of the genome to the human DMD gene and similarly lacks the dystrophin protein. Slices of mice tibialis anterior muscles were studied corresponding to different classes: healthy, diseased and gene-therapy treated mice of various age, and in lateral and transversal directions. Hundreds of SIMS data files were generated in the study on Duchenne dystrophy. Each of these files contains mass spectra of each pixel and information about the localisation of pixels. Each analysed zone is composed of 256×256 pixels (total 65536 pixels), so 65536 spectra were acquired for one SIMS image (300-800 Mo per image). Totally 372 spectra have been generated corresponding to 3 conditions: healthy, mdx and mice treated by gene therapy.
To analyse this huge quantity of information, Généthon utilized the multivariate statistical routines (Wilcoxon signed rank test) and temporal and spatial correlation (PCA and Hierarchical clustering) tools developed in the frame of the Computis project. Application of the non-parametric Wilcoxon test for comparison of healthy versus mdx permitted to identify a list of ions which expression is statistically different between these two populations.
Application to a multimodal imaging MS experimentSuccess of an imaging MS experiment depends on the combination of many important steps starting from collection of the sample to the processing of the raw data for the final evaluation of the results. The figure below summarizes the flow diagram of the computational steps. 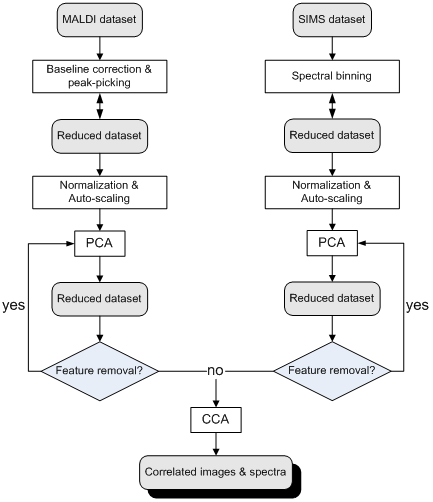 Schematic of the computational steps performed on multimodal MALDI and SIMS imaging datasets Prior to PCA and CCA analysis, MALDI and SIMS datasets have to be pre-processed since especially PCA is a sensitive technique. The datasets should be baseline corrected (in case of the MALDI dataset to generate discrete data) and reduced by a peak-picking algorithm. The first step in the statistical analysis involves PCA to minimize the noise and reduce the size of the data. A prior normalization and auto-scaling is important since, without these pre-processing, the low intensity signals may be omitted in the PCA step. The data analysis schema allowed us to remove unwanted features, both spectral (m/z channels) and spatial (spectra/pixels), originating from chemical or instrumental noise. After pre-processing the data the MALDI data set contained 1306 spectra and 536 m/z channels. The SIMS dataset contained 1306 spectra and 500 m/z channels. The data are evaluated manually by checking the PC score images and related PC loadings. The score images are created by projection of the original spectra onto the calculated PC axes and plotting them in the x-y plane. Each PC yields 2 images: one for the positive scoring spectra and one for the negative scoring spectra. After every PC analysis, the irrelevant features were removed from the datasets. For instance, we observed that the first PC of the MALDI dataset originates from the rim of the tissue (data not shown). Inspection of PC1 shows that the m/z values with a negative loading on PC1 are related to the matrix compound. The intense matrix signal creates an artifact, known as ion-suppression effect, in which it dominates the spectra and the images. We removed all m/z values with a negative loading on PC1 and re-run the analysis. This significantly improved the resulting PC score images. PCA analysis of the SIMS dataset showed as main source of variance the difference between signal originating from the tissue surface and signal originating from outside the tissue surface. All pixels outside of the tissue surface scored positive on PC1, whereas all signal from the tissue surface scored negative on PC1. Removal of the off-tissue spectra from both datasets greatly improved the results of the PCA because of the reduction of chemical and spatial noise. The 4 highest ranked PC’s from the SIMS and MALDI data are plotted as score images in the figures below (upper group of images).  PCA score images (above) vs. CCA score images (below) on SIMS data for human cerebellum tissue  PCA score images (above) vs. CCA score images (below) on MALDI data for human cerebellum tissue. The final step of the procedure is to perform CCA to correlate the two datasets. To be able to calculate the correlation matrix, the input matrix for CCA must be square thus we must use the same number of PC’s from both datasets. It is inevitable that we are introducing PC’s containing noise from one of the datasets since it is unlikely that both datasets produce the exact same number of relevant PC’s. The optimal number of relevant PC’s to take into account for an optimal CCA is hard to determine since we are dealing with two different datasets. There many approaches found in literature to determine the number of relevant PC’s.
SamPS (Sample Positioning System)SamPS (Sample Positioning System) is a positioning system that allows the combination of complementary imaging methods with the help of position markers, which are attached onto the target surface. Since images of the different imaging techniques often differ heavily, SamPS is not restricted to one special marker, but it is flexible since it allows the definition of different markers. Therefore the user defines the marker in the image that was acquired with the first method. Furthermore he defines an additional region that shall be analysed with another method. After that the sample is placed into an instrument capable to perform the second imaging measurement. SamPS detects the position marker semi-automatically and calculates the location and size of the region of interest. Then, with the help of these data the region can be imaged. Finally, SamPS combines the two different images of the region of interest.  A SamPS alignement example.
The self-organizing map for imaging mass spectrometryThis section describes the self-organizing map feature, which is included in the Datacube Explorer visualization application. This analysis is classified as unsupervised competitive learning, and is also known as the Kohonen (neural) network. After a correctly parameterized analysis, an overview of typical image patterns becomes available. The figure below shows the principle of using the self-organizing map for the images of an imaging mass spectrometry data set. 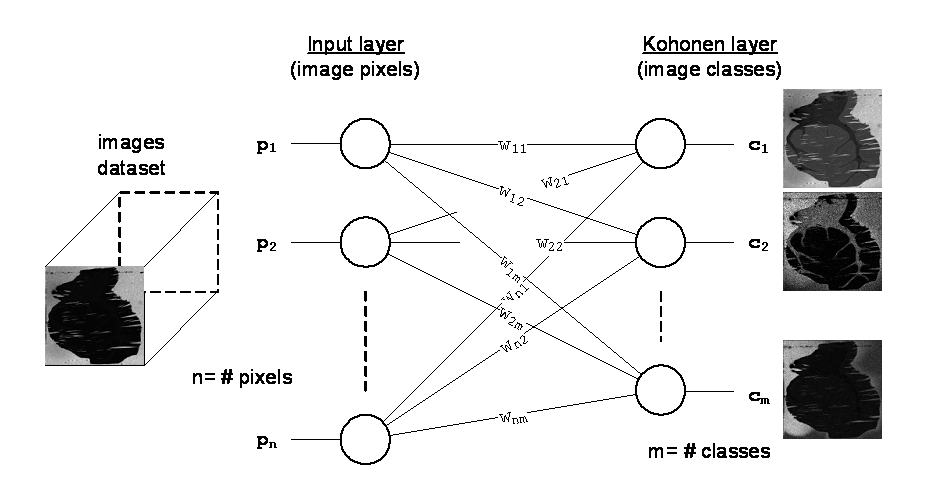 Principle of Kohonen neural network architecture The intensity values of the pixels of every image are fed into the input layer of the Kohonen neural network. Therefore, the number of input neurons n is equal to the number of pixels in an image. The output layer consists of m neurons, the number of image classes. Every output neuron c itself consists of n ‘pixels’, which represent a classification of the input image data set. However it is not shown in figure 5.1, the output layer is two dimensional, and typical images of the dataset are therefore ordered in a two-dimensional way 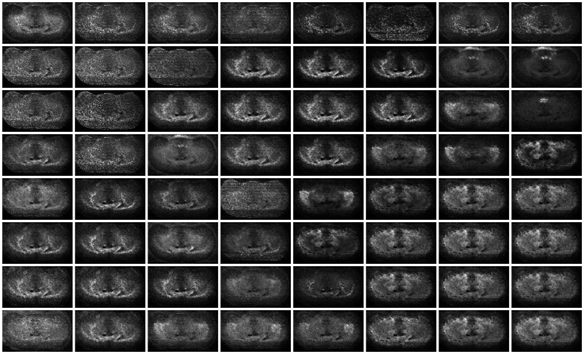 Typical output of the Kohonen neural network, for a 8 by 8 output configuration
Cannonical correlation analysisCanonical Correlation Analysis can be employed to correlate two datasets from the same sample. This is an advanced form of datafusion. It requires the original imaging MS data to be reduced with principal component analysis prior to CCA. This can be achieved with the basic multivariate analysis software described in D5.2 or with the more advanced approach described in the previous section. To be able to calculate a correlation matrix describing the correlation between a MALDI and SIMS data set, the input matrix for CCA must be square. First we have to employ a method to determine the number of relevant PC’s Most of the approaches available in literature apply to a single dataset. As we are looking for the optimal correlation between two datasets we developed a new approach to determine the optimal number of PC’s for performing CCA that is described in this report. The criterion for choosing this number is that each PC added to the matrix must add more significant information than noise. The canonical variant space (CV space) is calculated repeatedly using an increasing number of PC’s. Visual inspection of the principal component score images reveals that there are at least 5 relevant PC’s in both datasets. The CV space is calculated using an input dataset created by 5 to 50 PC’s. After each calculation the correlation coefficient between the scores of both datasets in the CV space, the CCA factors (CCAF), are stored. Quadratic summation of the 5 highest ranked CCAF’s shows a curve that maximizes at the optimum number of PC’s to use, which is in this case is 15 (as shown in the graph below). The graph thus reveals the point where the extra PC’s start to introduce more noise than useful signal. This maximum CCAF criterion produces good results. Visual inspection of the corresponding CV score plots agrees with the optimal number of PC’s to choose. The 2 highest ranked CV’s from the SIMS and MALDI data are plotted as score images in the figure shown below. The significance level of the CCA is 0.1748 (70% of the mean canonical correlation). This implies that the 7 highest ranked CV’s are significant.  CCAF plot for 5 to 50 PC’s 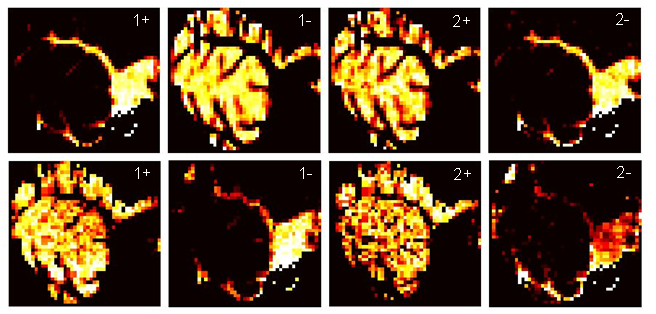 CCA score images for SIMS (top row) and MALDI (bottom row) data of the human cerebellum tissue. If we compare the score images calculated using PCA and the ones using CCA we can clearly see that the image contrast, and thus the interpretability, is improved by the CCA procedure. Combining the information of both datasets yields more information since we have linked the spectra in a statistical manner. The canonical correlations (defined as the square root of the Eigenvalues) of the 4 highest ranked canonical variates are 0.9229, 0.6162, 0.5936 and 0.3379, the image correlations (CCAF) -0.8695, 0.6472, 0.3195 and 0.2154. The CV1+ loadings of the SIMS data show cholesterol related m/z channels, and has a strong correlation with a number of peptide m/z channels (~1700 to 4000 m/z) of CV1- of the MALDI data. Similarly, the CV1- loadings of the SIMS data show choline related m/z channels which are strongly correlated to the corresponding peptide signals (~1100 to 2000 m/z) of CV1+ in the MALDI data.
Data standard implementationThe data standard imzML has been specified by the COMPUTIS partners. Several tools have been modified in order to support imzML. This implemented standard greatly facilitates the combination of different imaging techniques and allows the comparison of data for the evaluation of different methods. Many additional tools are available through mzML. In the long run a full integration of the imzML into the HUPO PSI mzML format is planned in order to increase the number of available tools and ease of use. We will illustrate the different imzML enabled modules developed by and within the COMPUTIS consortium. Imaging mass spectrometry is the method of scanning a sample of interest and generating an ‘image’ of the intensity distribution of a specific analyte. The application of MS imaging is rapidly growing with a constantly increasing number of different instrumental systems and software tools. An overview of methods and applications of mass spectrometry imaging has been recently published. This method results in a large number of spectra which are typically acquired with identical measurement parameters. The data format described in this deliverable is the result of input of many partners within the COMPUTIS consortium. The development of a data standard is well embedded in the overall goal of this project; the development of new and improved technologies for molecular imaging mass spectrometry. An important task was the comparison of images generated by diverse types of mass spectrometers. Therefore a standard format for the exchange of MS imaging data was needed. Both the DICOM standard for in-vivo imaging data and the mzML standard by HUPO-PSI are not able to completely represent an imaging MS experiment. Therefore a standardized data format was developed to simplify the exchange of imaging MS data between different instrument and data analysis software. Several of these data formats utilize two separate files: a small file (ini or XML) for the metadata and a larger (binary) file for the mass spectral data (e.g. Biomap and internal data formats at FOM and JLU). This structure proved to be very useful for flexible and fast handling of the imaging MS data and it was decided to follow this approach for the new data format. In order to keep as close as possible to existing formats we decided that the (small) metadata file should be based on the mass spectrometry standard mzML developed by HUPO-PSI. A more detailed discussion on why mzML was not fully implemented and about the relation between the two data formats (mzML and imzML) is found in WP 4. A new controlled vocabulary was compiled for imzML to include parameters that are specific for imaging experiments. All relevant information about imzML including specifications and example files can be found at www.imzML.org. The following section describes available software applications including an example for a file converter are presented. The fundamental goal while developing imzML was to design a data format for the efficient exchange of mass spectrometry imaging data. At the same time the format should be easily interchangeable with mzML. The main imzML development targets were:
The success of imzML can be measured by the amount of interest of the imaging MS instrumentation vendors.
Overview of imaging MS software that has imzML capabilities.
|
||||||||||||||||||||||
| < Prev | Next > |
|---|

