| Workpackage 6: Biological Applications |

|

|

|
|
Workpackage 6 is the final experimental workpackage of the COMPUTIS project. It integrates the developments of the other workpackages which include sample preparation (WP1), instrumental developments (WP2), measurements techniques (WP3) and software tools (WP4&5). The specific objectives of WP6 are:
Infected tissue samples: Mycobacterium tuberculosis
Tuberculosis is an infectious disease primarily caused by Mycobacterium tuberculosis. Tuberculosis may affect many body organs, but primarily affects the lungs. Infectious tuberculosis is characterized by the development of many lesions (granulomas) within the affected organ. The figure below shows the optical image and three lipid signals from imaging mass spectrometry. The aim of this study is to monitor the uptake of tuberculosis drugs into granulomas. Initial experiments focus on granulomas chemically induced via direct injection of trehalose dimycolate. However, advanced-stage granulomas did not develop and later studies (including the examples shown below) were performed using traditional aerosol infection models.  Distribution of three lipid species within granuloma and normal lung tissue. Strong signals were observed for species present in the granuloma, granuloma margin, and normal lung tissue regions. MALDI-MSI of infected lung biopsies revealed the drug moxifloxacin penetrated into the granulomas and accumulated within (as shown in the figure below). 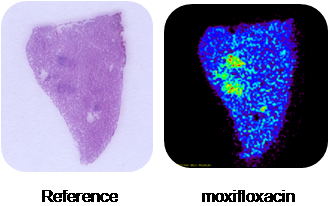 Accumulation of the drug moxifloxacin within lung granulomas.
Cellular reference objects
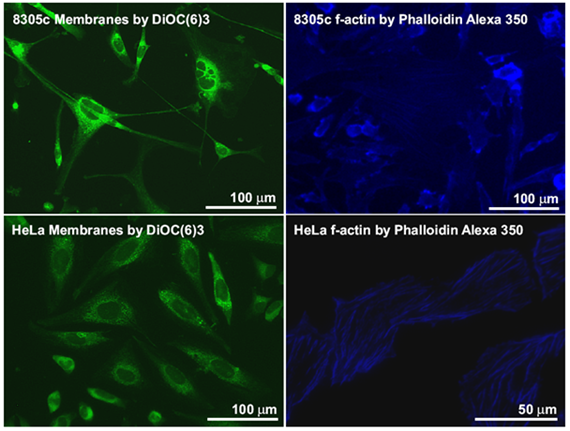
Cell cultures are used as model systems to study the pathogeneses and treatment of different diseases. Different cell cultures were treated with fluorescent labels. These tracers accumulate in the cell membrane (left) or the actin cell skeleton (right). These measurements are used as a reference for evaluating MS imaging experiments.
MS imaging of Neuropeptides at 10 µm
The high resolution MS imaging technique developed at JLU was also used for the analysis of neuropeptides at 10 µm pixel size (mouse pituitary gland). The pituitary gland is composed of three lobes: the anterior lobe (adenohypophysis), the posterior lobe (neurohypophysis) and the intermediate lobe (pars intermedia). The anterior lobe is made up of epithelium cells. It synthesizes and secretes important endocrine hormones, such as TSH, PRL, GH, FSH, and LH. The posterior lobe is made up of glial cells. Hypothalamus and posterior lobe of the pituitary gland are directly connected via neurons. The hormones vasopressin and oxytocin synthesized in the neurons nuclei are stored and released in the posterior lobe of the pituitary gland. The hormones ACTH, β-endorphin and MSH are synthesized in the intermediate lobe by cleavage of the protein POMC. 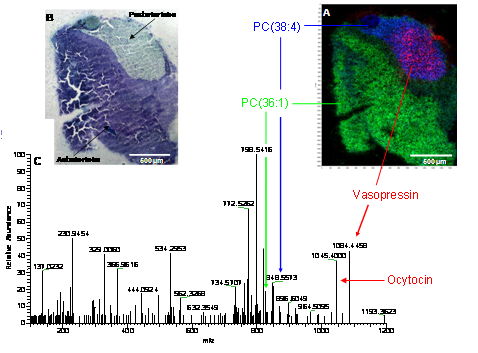 Neuropeptide in mouse pituitary gland: (A) overlay of selected ion images: [M+H]+ of vasopressin (m/z = 1084.4451 u, red), PC (36:1) (m/z = 826.5723 u, green), PC (38:4) (m/z = 848.5566 u, blue);10 Ám step size, (B) optical image after toluidine staining, (C) Full scan spectrum of individual pixel. Toluidine staining of mouse pituitary gland is shown in Figure above. The tissue slice was stained with toluidine after mass spectrometric measurement. Cell nuclei are colored in blue. Since the posterior lobe contains mainly the axons of neurons and thus few cell nuclei it shows less blue staining than the other two lobes. The mass spectrometric measurement was done with high mass accuracy (>2 ppm), high resolution (R=30000) and high lateral resolution (step size 10 µm). The overall structure of the gland is nicely reproduced in the selected ion images. Posterior lobe and anterior lobe can be clearly distinguished by their lipid distributions. The ion image of vasopressin shows its occurrence solely in the posterior lobe, as expected. Oxytocin was also found in the posterior lobe. The identity of hormone peptides was confirmed by accurate mass and on tissue MSMS measurements.
Characterization of phospholipids in human breast cancer at 10 µm The detailed distribution of phospholipids in breast cancer tissue was investigated in first experiments with the high resolution MS imaging approach. Human tissue sections of infiltrating ductal carcinoma, the most abundant and also most dangerous type of breast cancer were analyzed. Since the malignant proliferation usually infiltrates surrounding adipose tissues, the histological investigation of intraoperative fresh frozen samples is not straightforward due to undesirable characteristics of adipose tissue. While classic histology provides ambiguous results, AP-SMALDI imaging of these tumors resulted in distinction of tumor and surrounding healthy tissues. Specific lipid profiles provide the possibility of unequivocal identification of cancer cells by MS imaging. In figure below, a thin section of infiltrating ductal carcinoma is shown with clear distinction of cancerous (red) and healthy (green) tissue at 10 µm spatial resolution. The tumor region features high signals of m/z = 896.6006 which corresponds to an adduct of PC (34:1) ([M+K+DHB-H2O]+). A single pixel mass spectrum of this measurement in shown in below. Numerous peaks corresponding to phospholipids are detected with high mass accuracy. These results have been published in Römpp, A., S. Guenther, Y. Schober, O. Schulz, Z. Takats, W. Kummer, and B. Spengler, Angewandte Chemie International Edition. 49(22): p. 3834-3838. 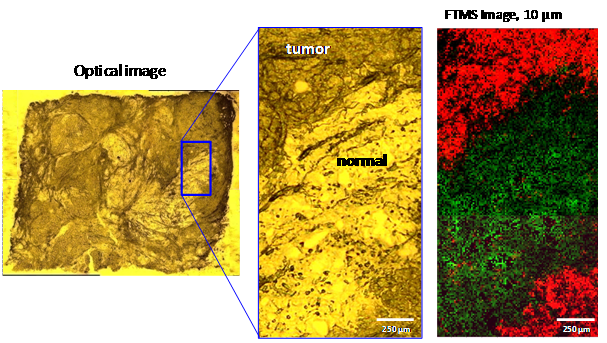 Human ductal carcinoma. (A) Optical image of tissue section. Darker areas indicate tumor tissue (B) 10 Ám step size, overlay of selected ion images of m/z = 529.3998 (healthy, green), m/z = 896.6006 (tumor, red, PC (34:1), [M+K+DHB-H2O]+) 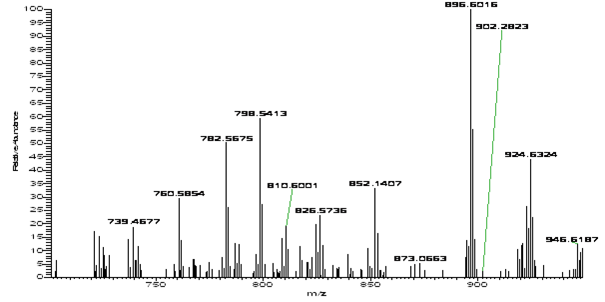 Single pixel FT mass spectrum (10 Ám) of human ductal tumor
Duchenne Muscular Dystrophy
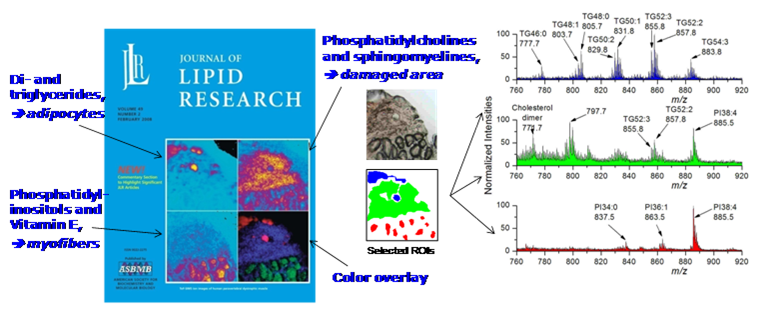
Human studies Duchenne muscular dystrophy (DMD) is the most common genetic disorder and affect 1/3500 male in humans. It is characterized by the lack of dystrophin, a protein which is needed for normal muscle functions. Human striated muscle samples, from male control and Duchenne muscular dystrophy-affected children, were subjected to cluster-time-of-flight secondary ion mass spectrometry (cluster-ToF-SIMS) imaging, using a 25 keV Bi3+ liquid metal ion gun under static SIMS conditions. Spectra and ion density maps, or secondary ion images, were acquired in both positive and negative ion mode over several areas of 500 x 500 µm2, leading to an initial image resolution of 256 x 256 pixels. Several lipid markers have been identified in situ at the micrometer scale. Characteristic distributions of various lipids were observed. Vitamin E and phosphatidylinositols were found to concentrate within the cells, whereas intact phosphocholines accumulated over the most damaged areas of the dystrophic muscles. The same was observed for the cholesterol and sphingomyelin species. The fatty acyl chain composition of the phospholipids varied depending on the region. All these results allowed the estimation of the local damage extent. The results were published in N. Tahallah, A. Brunelle, S. De La Porte, O. Laprévote, J. Lipid Res. 2008, 49, 438-454.
Evaluation of gene therapy on MDX model Restoration of Dystrophin expression by exon skipping. In mdx mice there is a premature stop codon in the exon 23 of the dystrophin gene. mRNA coded the mutated gene is unstable and there no dystropin production in the cells. Intramuscular injection of an AAV vector coding for the small RNAs, complementary to the splicing branching point in the intron 22 and to the U1 binding region in the intron 23 leads to the deletion of the mutated exon 23 and restoration of the open reading frame. This approach permits to skip out the defective exon and thus reconstitute a shorter but functional modification of dystrophin. Expression of dystrophin is completely restored in two weeks followed by normalisation of the muscle morphology. In this study we compared muscles from wild type, mdx and mdx mice after gene therapy by imaging SIMS mass spectrometry. Mdx model shows a complex time course of muscle degeneration/regeneration. In young and adult mice (up to 52 weeks old), muscle fibre necrosis is compensated by a vigorous regeneration, with a maximum of regeneration observed at 4 weeks. In order to perform a comprehensive comparison of muscle from wild type, mdx and mdx mice after gene therapy we compared muscles of mice from 3 to 15 weeks old. 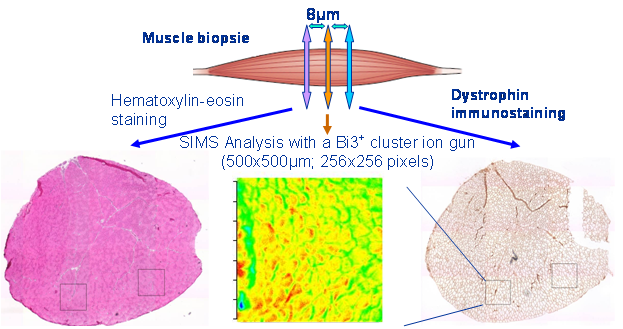 Repartition of muscle slices for analyses. Statistical analysis of the data was performed by using FxSpectViewer software developed by CEA and in collaboration with CEA. The following modules were explored: data conversion; statistical analysis; temporal and spatial correlation (PCA and Kmeans clustering). Data analysis was organized in the following data flow: (1) data pre-processing (conversion of .RAW data (Ion-ToF) into .FXS (FXS spectviewer) followed by data binning; (2) statistical analysis (Wilcoxon signed rank test); (3) temporal and spatial correlation (Kmeans clustering, PCA and hierarchical clustering). 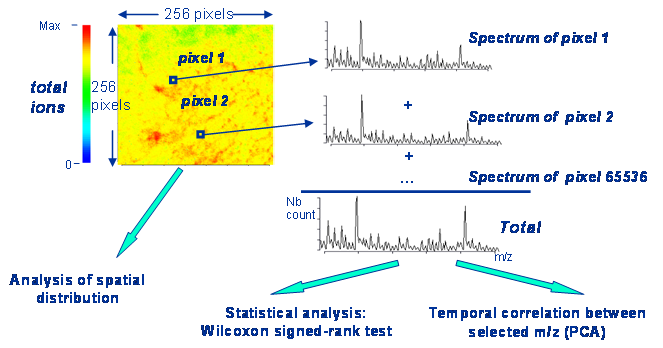 Data analysis workflow.
Round robin experiment with biological tissue
A wide variety of methodologies and instrumentation can be used for mass spectrometry imaging. As part of WP6 the scope and limitations of the imaging approaches at the different partner laboratories were evaluated in a systematic study. The results can serve as a guideline which method/instrument is most suitable for specific applications in order to assist scientists in choosing the best approach for their application. Standard biological tissue samples (mouse brain sections) were distributed to the partners for MIMS experiments. MALDI as swell as SIMS sources were included in this study. The instrumentation included quadrupole, time of flight and Fourier transform mass analyzers. SIMS measurements were able to resolve features in the range of 1 micrometer for small molecules such as fatty acids. The fastest measurements were acquired in the selected reaction monitoring mode (SRM) on a triple quad instrument. An overlay of selected measurements is shown below. 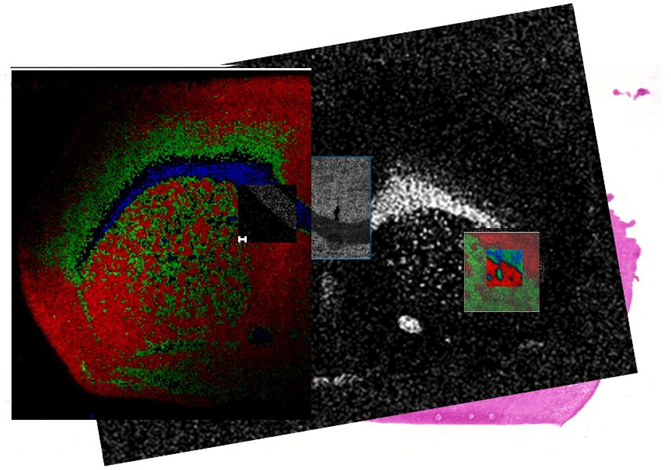 Overlay of selected MS images of a mouse brain section acquired by different methods. As expected each of the measurement techniques had specific advantages. The highest spatial resolution (down to 2 µm) was achieved with the SIMS-TOF measurements. The usage of clustezdfr ion source allows detection of intact lipids with SIMS, which would not be possible otherwise. SIMS measurements of FOM can be resampled and thus areas of interest can be analyzed in more detail. The highest resolving power and mass accuracy was achieved by Fourier transform mass spectrometers (both ion cyclotron resonance and orbital trapping analyzers). A newly developed ion source allowed the combination of accurate mass measurements and spatial resolution in the micrometer range for phospholipids. The fastest measurements were acquired in the selected reaction monitoring mode (SRM) on a triple quad instrument utilizing continuous raster mode. This technique allows high through-put screening of drug compounds and their metabolites. MALDI-TOF measurements were best suited for the analysis of proteins. The best combination of sample preparation, ionization type and mass analyzer is highly dependent on analyte and sample properties and has to be chosen carefully. A more detailed description of the results will be published in a scientific journal in order to make them available to the MS imaging community.
|
| < Prev |
|---|

